
API Documentation Metrics: What to Track and Why

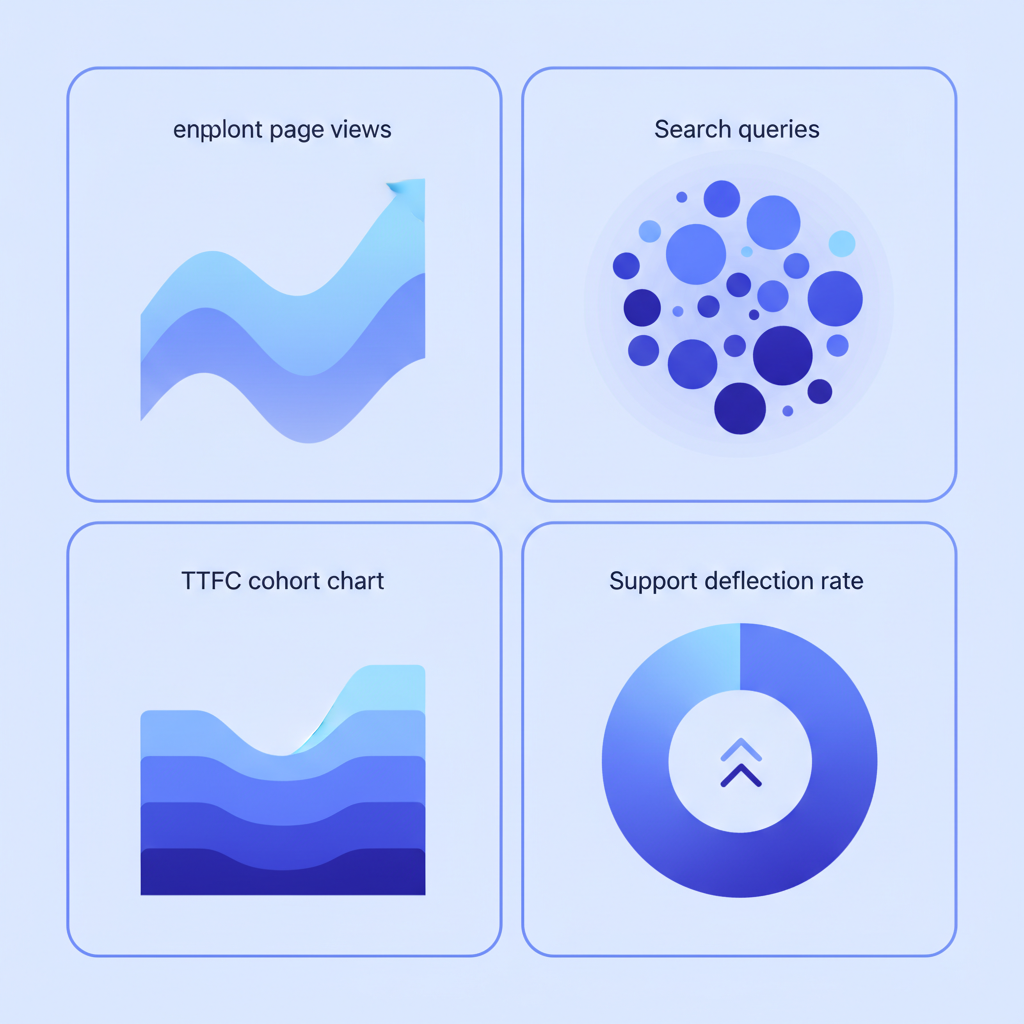
API documentation metrics are quantitative signals that tell you whether your docs are actually helping developers succeed. The four most actionable ones are: page views per endpoint, in-docs search queries, time-to-first-call (TTFC) by cohort, and support ticket deflection rate. Tracking these alongside Apidoke lets product managers and DevRel leads make evidence-based improvements instead of guessing.
- Page views per endpoint reveal which resources developers visit most and which are silently ignored.
- In-docs search queries expose vocabulary gaps: terms developers type but your docs never use.
- Time-to-first-call (TTFC) measures how quickly a new developer fires a real, successful API request after first touching your docs.
- Support deflection rate quantifies how often docs answer a question before a support ticket is ever opened.
Why quantitative metrics and qualitative evaluation are different jobs
Qualitative methods, like heuristic review or usability testing, tell you why something is broken. Quantitative metrics tell you what is broken and at what scale. Both matter, but they serve different personas. A DevRel lead running a developer usability session gets rich narrative. A product manager staring at a quarterly roadmap needs a number to defend prioritisation. This article is for the second person.
The four metrics below are not decorative. Each maps to a specific failure mode in API onboarding, and each is actionable: you can change something in the docs and watch the number move.
Metric 1: Page views per endpoint
What it measures
A page view per endpoint is exactly what it sounds like: how many times a given reference page, scoped to one HTTP resource and method, was loaded in a time window. In a 3-column reference layout like the one Apidoke renders, each endpoint is a discrete scrollable section or anchor, so you can attach analytics at that granularity.
Why it matters
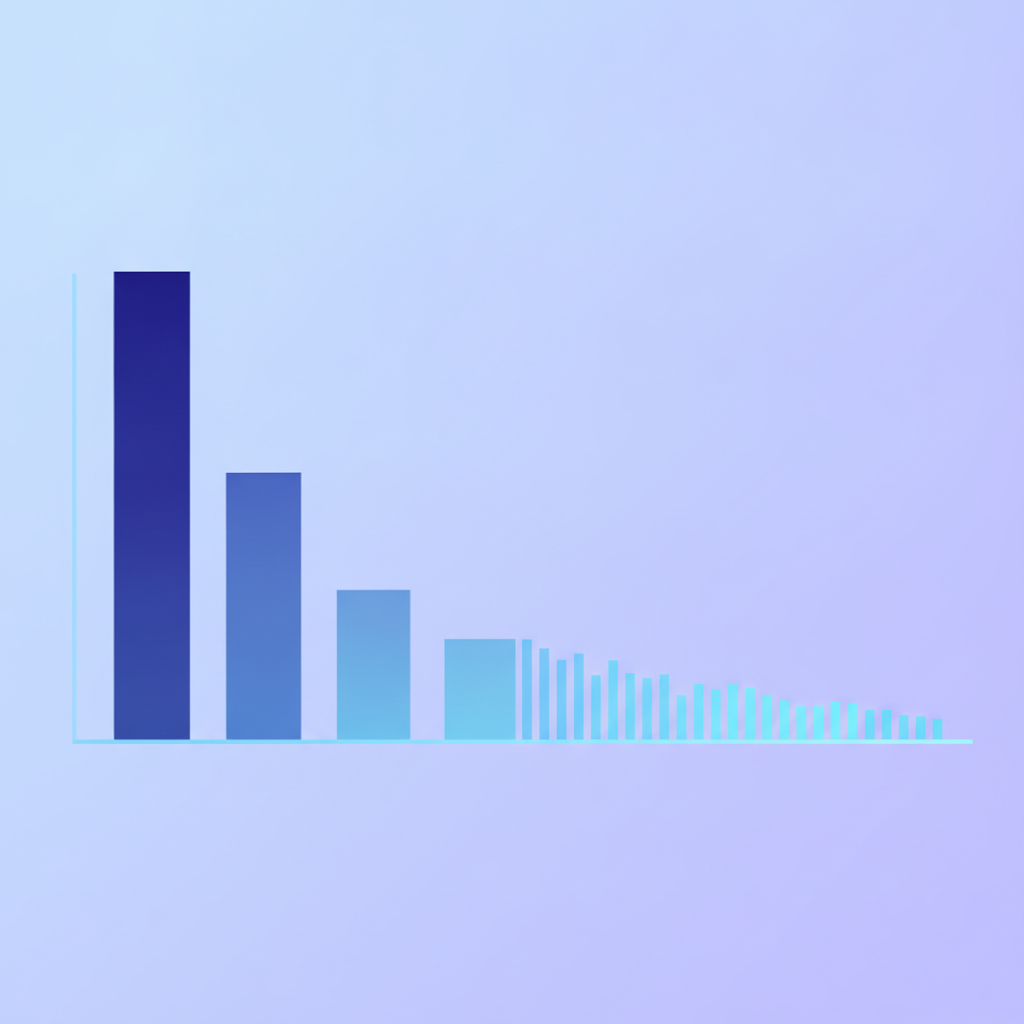
Traffic distribution across endpoints is almost never uniform. In practice you will find a long tail: three or four endpoints absorbing 60 to 70 percent of visits, and a cluster of rarely-touched pages. That pattern tells you two things. First, the high-traffic endpoints deserve the most documentation investment: complete request and response examples, every possible 4xx error code (400, 401, 403, 404, 422), and multiple code samples. Second, near-zero-traffic endpoints might be poorly named, buried in navigation, or genuinely unused, which is itself a product signal worth escalating.
How to set it up
Because Apidoke publishes standard HTML to your own infrastructure when self-hosted, you can instrument it with any page-level analytics tool that reads the URL or the anchor fragment. The key is to normalise your URL scheme before you start collecting data. A sensible convention is:
/reference/{version}/{resource-group}/{method}For example, /reference/v2/orders/get-order maps cleanly to the GET /orders/{id} action. Once that mapping exists, you can join page-view data to your API Blueprint source, specifically to the ## GET /orders/{id} action heading, and track coverage automatically.
What to do with the data
Sort endpoints by descending page views, then cross-reference with your support ticket categories. If POST /payments is your most-visited page and also your most-ticketed endpoint, the docs are not answering the questions people arrive with. If DELETE /subscriptions gets almost no views but generates tickets, the endpoint is hard to find. Fix navigation first, then content.
Metric 2: In-docs search queries
What it measures
In-docs search queries are the literal strings developers type into the search box on your documentation site. This is distinct from external search (what they type into Google before arriving). Internal search is a real-time vocabulary audit.
Why it matters
Every failed search is a vocabulary mismatch. A developer types "webhook payload format" and your docs only use the phrase "event notification body." They type "401" and your authentication page is titled "Security Schemes." Each of these mismatches is a drop in the bucket that slowly drains developer confidence. Aggregated over a month, failed or low-result searches form a clear hit list for terminology fixes.
Segmenting by query result count
The most useful cut is queries that returned zero results versus queries that returned results but the developer still left without clicking. Zero-result queries point to missing content or wrong terminology. High-impression, zero-click queries usually mean the search snippet does not answer the question, so the page title or opening sentence needs work.
A practical threshold: any query with more than 10 occurrences and a click-through rate below 20 percent in a 30-day window is a documentation bug, not a search bug. Fix the content, not the search index.
Feeding search data back into API Blueprint source
When you identify a recurring query that has no matching page, you have two options. You can add a dedicated section to an existing endpoint page, or you can add a named anchor in your API Blueprint file so the search index picks it up. In API Blueprint, you do this by adding a named subsection under an action:
## Retrieve an Order [GET /orders/{id}]

Returns a single order by its unique identifier. A 404 is returned
if the order does not exist. A 401 is returned if the request
lacks a valid Bearer token.

+ Parameters
    + id (string, required) - The order UUID.

+ Request (application/json)
    + Headers

            Authorization: Bearer <token>

+ Response 200 (application/json)
    + Body

            {
              "id": "ord_8f3a",
              "status": "fulfilled",
              "total": 4999
            }

+ Response 401 (application/json)
    + Body

            {
              "error": "unauthorized",
              "message": "Missing or invalid Bearer token."
            }

+ Response 404 (application/json)
    + Body

            {
              "error": "not_found",
              "message": "No order with that id exists."
            }
Adding the exact error codes (401, 404) and the exact phrase "Bearer token" to the Blueprint source means the rendered page will now match those search queries.
Metric 3: Time-to-first-call (TTFC) by cohort
What TTFC is
Time-to-first-call (TTFC) is the elapsed time between a developer's first interaction with your documentation and the moment they receive a successful HTTP 200 response from a real API endpoint, whether that call comes from Apidoke's built-in try-it console or from their own client code. It is the single most direct measure of onboarding friction in your docs.
TTFC is almost always measured in minutes for a well-designed reference, and in hours or days for a poorly designed one. The gap between those two outcomes is almost entirely documentation quality and structure.
Why cohort analysis matters here
A raw average TTFC hides important variance. You need cohorts. Segment developers by at least three dimensions:
| Cohort dimension | Why it changes TTFC | What to look for |
|---|---|---|
| Acquisition channel (docs search, direct, referral) | Developers arriving from a Google search for a specific endpoint already have context; those landing on the homepage do not | High TTFC for direct or homepage arrivals signals a weak quickstart |
| Declared experience level (if you ask during signup) | Senior engineers may skip tutorial content; junior developers may need more scaffolding | If experienced developers also have high TTFC, the reference docs are the problem, not the tutorial |
| Date of first visit (by week or sprint) | TTFC should fall over time as you improve docs; if it rises after a release, that release introduced documentation debt | Spikes in TTFC that coincide with API version releases |
How the try-it console reduces TTFC
Apidoke's live try-it console lets a developer fire a real HTTP request directly from the documentation page. Authentication tokens are entered in the browser and never sent to Apidoke servers; they go straight to your API. That means the path from "I am reading the docs" to "I have a 200 response in front of me" is as short as it can possibly be: no Postman download, no curl command to construct, no environment variable to set up.
When you instrument your API server logs, a try-it console call is identifiable by the Referer header or a query parameter you append. Compare TTFC for developers who used the console against those who did not. In most cases, console users reach their first successful call meaningfully faster, and that delta is the business case for keeping your try-it console instrumented and up to date.
For more on how the console works, see what makes API docs interactive and how try-it consoles work.
Metric 4: Support ticket deflection rate
What it measures
Support deflection rate is the percentage of potential support tickets that are resolved by the documentation before a developer contacts your team. You cannot measure it directly, but you can approximate it two ways.
The first approximation uses a "Was this helpful?" widget at the bottom of each endpoint page. A developer who clicks "Yes" almost certainly did not open a ticket. Track the ratio of "Yes" clicks to total page views per endpoint and compare it to the ticket volume for that endpoint. High "Yes" rate plus low ticket volume is good deflection. Low "Yes" rate plus high ticket volume is a clear improvement target.
The second approximation uses your support tool's ticket categories. If you tag tickets by the endpoint or concept they relate to, you can divide ticket volume by total page views for that topic to get a rough "docs-failure rate." A ratio above roughly 1 ticket per 100 page views on any single endpoint is a red flag worth addressing before the next release.
Connecting deflection to documentation changes
Deflection rate is the metric that most directly translates to engineering cost. If your team spends 30 minutes per support ticket and you deflect 100 tickets a month, that is 50 hours of engineering time recovered. That number resonates in budget conversations in a way that "we improved our docs" does not.
To make the case, run a controlled comparison. Pick your top-five most-ticketed endpoints. Rewrite those docs pages with more complete error documentation: every 400, 401, 403, 404, and 422 you return, with example bodies and plain-language explanations. Measure ticket volume for those endpoints over the following 60 days. The delta is your deflection gain.
Putting the four metrics together: a simple dashboard
You do not need a dedicated analytics platform to track these four metrics. A spreadsheet updated weekly works for most teams until they are processing more than a few thousand developer sessions a month. The important thing is to review all four metrics together, because they tell a connected story.
| Metric | Leading or lagging | Update frequency | Primary owner |
|---|---|---|---|
| Page views per endpoint | Lagging (reflects past navigation behaviour) | Weekly | DevRel or docs team |
| In-docs search queries | Leading (reveals future content gaps) | Weekly | DevRel or docs team |
| TTFC by cohort | Leading (predicts activation rate) | Per release or sprint | Product manager |
| Support deflection rate | Lagging (measures past doc effectiveness) | Monthly | DevRel or support lead |
A healthy documentation programme shows page views trending toward the endpoints you want developers to use, search zero-result rates falling over time, TTFC shortening cohort-over-cohort, and support deflection rate rising. When one metric moves against the others, that is your diagnostic signal: a new endpoint launch might spike page views while also spiking support tickets, which tells you the launch docs shipped incomplete.
Metrics and version history: a compounding advantage
One practical challenge with documentation metrics is attributing changes in a number to a specific documentation change. If your docs are a single published file with no version history, you cannot run a before-and-after comparison with any confidence. Apidoke's per-project version history solves this by giving every published state of your docs a discrete snapshot. You can point to a specific version, compare its TTFC or deflection rate to the version before and after, and know exactly what changed between them.
This also supports a documentation comparison posture, even without a formal experimentation platform. Ship version A, collect metrics for two weeks, ship version B with a targeted change to one endpoint page, collect metrics for two more weeks, then compare. It is not statistically perfect, but for most teams it is far better than shipping changes and hoping for the best.
For the broader discipline of managing doc versions, see our guide on versioning API documentation with a practical workflow. And if you want the full strategic context these metrics feed into, the developer experience guide for API teams covers the layer above the numbers.
What good looks like: rough benchmarks
Benchmarks vary by API type, audience, and maturity, but these thresholds are a reasonable starting point based on patterns commonly reported in DevRel community discussions and the HTTP semantics defined in RFC 9110 that underpin how error codes are classified:
- TTFC under 10 minutes for a simple authenticated GET request is achievable with good quickstart docs and a working try-it console.
- In-docs search zero-result rate below 15 percent is a reasonable target for a mature docs site.
- Support deflection rate above 70 percent (meaning fewer than 3 tickets per 10 expected support interactions) is typical for well-maintained public API docs.
- No single endpoint should account for more than 40 percent of total support tickets if your top-10 pages are properly documented.
The API Blueprint specification does not prescribe metrics, but the structured format it enforces (explicit resources, actions, request and response examples) makes it much easier to instrument docs at endpoint granularity, because every endpoint is a clearly delimited unit in the source file.
Frequently asked questions
What is the most important API documentation metric to start with?
Start with in-docs search queries. They require no changes to your API or your analytics setup, they update continuously, and they produce an immediate, prioritised list of content gaps. Most teams find they can act on the top-five search failures within a single sprint.
How do I measure time-to-first-call if I do not require developer signup?
Use your API server logs rather than your docs analytics. Assign a unique identifier in the docs via a URL parameter or a sandbox API key issued on first visit, then match that identifier to the first successful 200 response in your server logs. The timestamp difference between the first docs page load and the first 200 is your TTFC, even without a formal signup flow.
Can I track these metrics if my API docs are self-hosted?
Yes. Self-hosted docs give you more control over instrumentation than hosted platforms. You can inject any analytics script into your Apidoke deployment, use server-side log analysis, or pipe events to any data warehouse. Self-hosting also means you are not constrained by a SaaS platform's built-in and often limited analytics.
How often should I review API documentation metrics?
Page views and search queries are worth reviewing weekly, ideally in a standing docs review meeting. TTFC should be checked at every API release and every major docs update. Support deflection rate is a monthly or quarterly metric because it needs enough volume to be statistically meaningful.
What is a reasonable target for support deflection rate for a new API?
For a new API with fewer than six months of published docs, aim for 50 percent deflection as an initial target and work toward 70 percent over the first year. Deflection improves fastest when you close the loop between support tickets and docs updates within the same sprint the ticket was filed.
Start tracking metrics on docs you control
Metrics only matter if the underlying docs are instrumented and versioned. Apidoke gives you self-hosted, versioned API documentation with a built-in try-it console, so every metric you collect maps to a specific doc version and a specific endpoint. No credit card is required to get started. Create your free Apidoke account and publish your first measurable API reference today.