
Test API Endpoints in the Browser Without Postman

You can test API endpoints directly in the browser using Apidoke's built-in try-it console. The console fires real HTTP requests (GET, POST, PUT, DELETE, PATCH) from your browser tab, returns live status codes and response bodies, and requires zero installation. No Postman, no curl, no browser extension. Just open your published API docs and click.
- Apidoke's try-it console sends real HTTP requests from the browser and shows actual responses, including status codes like 200, 401, and 404.
- Auth tokens and credentials you enter stay in the browser and never pass through Apidoke's servers.
- The console is embedded directly in your published API reference, so readers can test without switching tools.
- All you need is an API Blueprint document and an Apidoke project. No Postman account, no paid plan.
Why test API endpoints in the browser at all?
The standard approach most developers learn first is to install Postman, create a workspace, configure an environment, and import a collection. That workflow is fine for deep integration testing, but it has friction: onboarding a new teammate means another install, another account, another synced collection to keep current. For quick spot-checks during API review, or for consumers who just want to verify an endpoint before writing code, a browser-native approach is genuinely faster.
Browser-based API testing means sending an HTTP request directly from a web page's JavaScript, using the Fetch API or XHR under the hood, and displaying the raw response inline. This is exactly what interactive API documentation tools build their try-it consoles on top of. The browser does the networking; the UI does the formatting.
One real constraint: browsers enforce the same-origin policy and CORS headers. If the API you are testing does not respond with appropriate Access-Control-Allow-Origin headers, the browser will block the request at the network level and you will see a CORS error in the console, not an API error. This is not unique to Apidoke; it applies to any browser-based client. The fix lives on the API server, not the documentation tool.
How does Apidoke's try-it console work?
When you publish an API Blueprint document with Apidoke, the platform renders a 3-column reference layout: navigation on the left, human-readable documentation in the center, and a live try-it console on the right. Each documented endpoint gets its own panel in that console.
Here is what happens when you trigger a request:
- You fill in any path parameters, query parameters, or a request body directly in the console panel for that endpoint.
- If the endpoint requires authentication, you paste your token or API key into the provided field. That value stays in your browser's memory for the session and is never sent to Apidoke's servers.
- You click the send button. The browser issues the HTTP request directly to the target API server.
- The console displays the raw HTTP status code (200 OK, 201 Created, 400 Bad Request, 401 Unauthorized, 404 Not Found, 500 Internal Server Error, etc.), the response headers, and the formatted response body.
- You can edit the request inline and resend as many times as you need.
Nothing in that flow requires leaving the browser tab, opening a terminal, or installing any software. The API Blueprint source in Apidoke's split-pane editor defines the available endpoints, expected request shapes, and documented response codes. The console reads that definition and pre-populates the form fields accordingly.
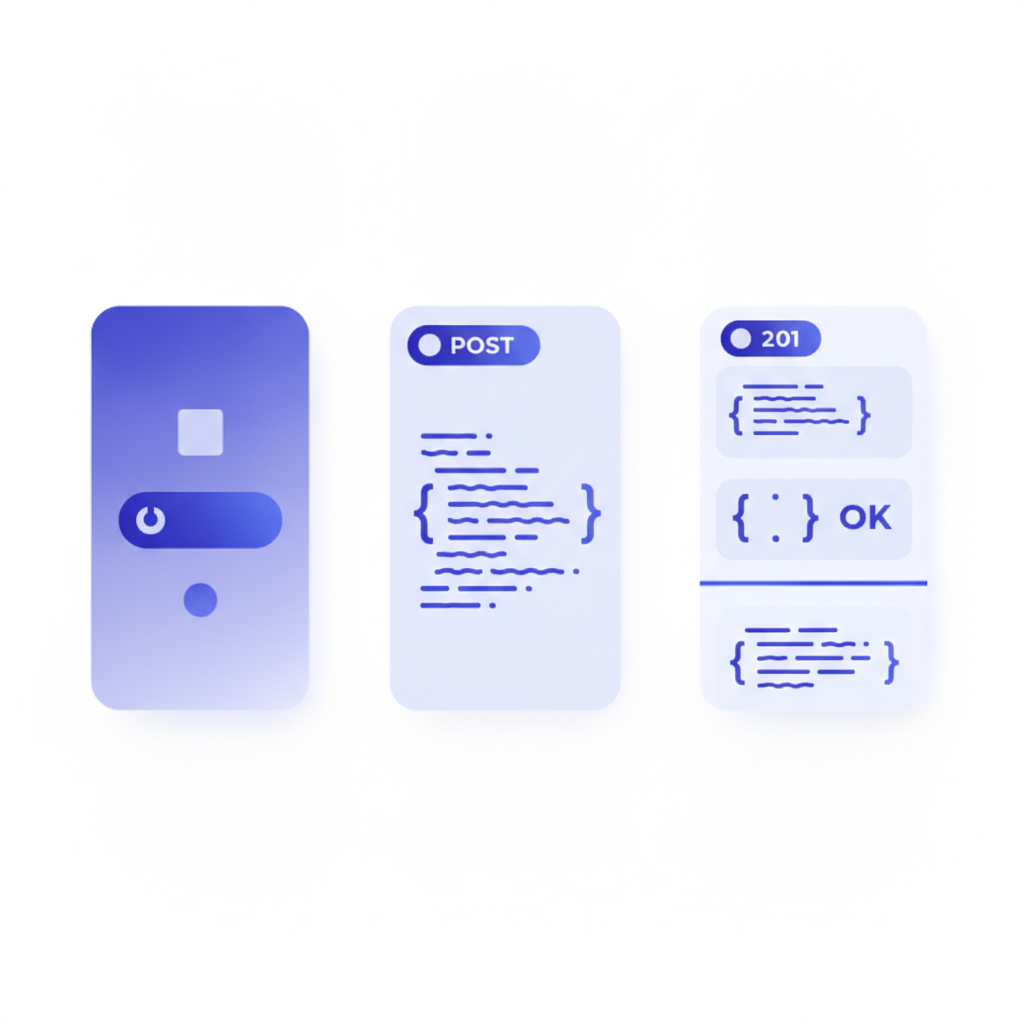
What does an API Blueprint endpoint look like in the editor?
API Blueprint (the open format Apidoke uses for all documentation) describes endpoints as named resources with actions. Here is a minimal, copy-paste example covering a user retrieval endpoint:
FORMAT: 1A
HOST: https://api.example.com

# Example API

## Group Users

### Get a User [GET /users/{id}]

Returns a single user by ID.

+ Parameters
    + id: `42` (number, required) - The user's numeric ID.

+ Request (application/json)
    + Headers

            Authorization: Bearer your-token-here

+ Response 200 (application/json)
    + Body

            {
              "id": 42,
              "name": "Alice Chen",
              "email": "alice@example.com"
            }

+ Response 401 (application/json)
    + Body

            {
              "error": "Unauthorized",
              "message": "Bearer token is missing or invalid."
            }

+ Response 404 (application/json)
    + Body

            {
              "error": "Not Found",
              "message": "No user with id 42 exists."
            }
When you paste this into Apidoke's editor, the live preview column renders it immediately. The try-it console on the right shows a GET form with an id parameter field and an Authorization header field pre-populated from the + Request block. The documented 200, 401, and 404 response bodies appear as reference examples below the live response area.
Documenting multiple response codes is not just cosmetic. It tells the person testing the endpoint exactly what a bad token looks like versus a missing resource, which saves real debugging time. For a deeper look at syntax patterns including POST bodies and grouped resources, the API Blueprint syntax cheat-sheet covers the full range of supported constructs.
Postman vs browser-based testing: a direct comparison
| Factor | Postman | Browser try-it console (Apidoke) |
|---|---|---|
| Installation required | Yes (desktop app or web login) | No |
| Account required | Yes (free tier requires sign-in) | No (public docs need no login to use the console) |
| Fires real HTTP requests | Yes | Yes |
| Auth token handling | Stored in Postman cloud or local vault | Stays in browser session only, never sent to Apidoke |
| Tied to API documentation | Separate collection, manual sync needed | Embedded in the doc, always in sync with Blueprint source |
| Shareable with consumers | Share collection link (requires Postman account to use) | Share the doc URL, console works immediately |
| CORS requirement | Not enforced (desktop app bypasses CORS) | Enforced by browser (API must serve correct CORS headers) |
| Best for | Complex test suites, automation, team collections | Quick endpoint verification, consumer onboarding, doc review |
The comparison is not meant to dismiss Postman. For scripted test suites with pre-request scripts and automated runs in CI, Postman is hard to beat. The browser console fills a different gap: low-friction, zero-install verification that anyone reading your docs can do right now.
How does the try-it console stay secure?
A reasonable concern when you paste a Bearer token into a documentation UI is where that token goes. In Apidoke's console, the request is constructed entirely in your browser's JavaScript runtime and dispatched directly from your browser to the API server. The request never passes through any Apidoke infrastructure. Apidoke's servers have no visibility into the token, the request payload, or the API response. This is the standard architecture for client-side try-it consoles, and it is the reason browser-based testing is privacy-safe for this use case.
The one exception to verify on your own is whether your API server logs incoming Authorization headers. That is a server-side concern independent of the documentation tool.
What about endpoints that require a request body?
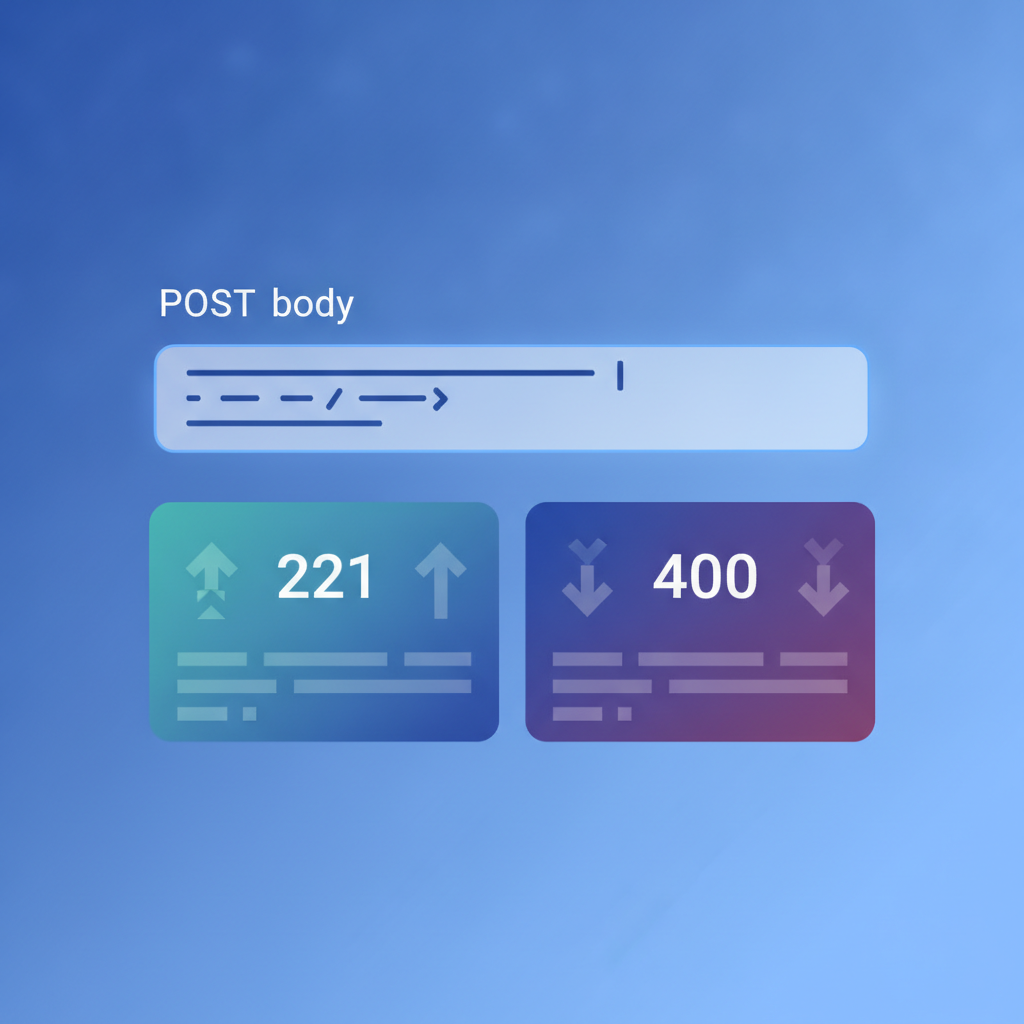
POST, PUT, and PATCH endpoints expect a body, usually JSON. The try-it console reads the + Request body from your Blueprint and pre-fills a JSON editor with the example payload. You can edit it inline before sending. Here is a minimal POST endpoint definition that produces a usable body editor in the console:
### Create an Order [POST /orders]

+ Request (application/json)
    + Headers

            Authorization: Bearer your-token-here

    + Body

            {
              "product_id": 7,
              "quantity": 2,
              "shipping_address": "123 Main St, Springfield"
            }

+ Response 201 (application/json)
    + Body

            {
              "order_id": "ord_9f3a",
              "status": "pending",
              "total_usd": 49.98
            }

+ Response 400 (application/json)
    + Body

            {
              "error": "Bad Request",
              "message": "product_id is required."
            }
The console renders the JSON body as an editable field. Change quantity to 0 and send; if your API returns a 400 with a validation message, you will see it immediately alongside the documented 400 example for comparison.
How do I set this up for my own API?
- Create a free Apidoke account at /register. No credit card is required.
- Create a new project and open the split-pane editor. The left pane is your API Blueprint source; the right pane is a live preview.
- Set the
HOSTdirective at the top of your Blueprint to your API's base URL (for exampleHOST: https://api.yourservice.com). This tells the console where to send requests. - Write or paste your endpoint definitions using
# Group,## Resource [METHOD /path],+ Request, and+ Responseblocks. - Click publish. Apidoke generates a public URL with the full 3-column layout including the live try-it console.
- Open the published URL, navigate to any endpoint, fill in parameters and a token if needed, and click send.
The whole process from a blank project to a live testable reference takes under ten minutes for a small API. For a step-by-step walkthrough of the publishing flow, see the guide on publishing your first interactive API doc with Apidoke.
For broader context on what interactive API docs are and why embedded consoles improve developer experience, the deep-dive on interactive API docs and try-it consoles is worth reading alongside this post.
Frequently asked questions
Can I test API endpoints in the browser without any tool at all?
You can use the browser's address bar for simple GET requests with no headers, but anything requiring an Authorization header, a request body, or a method other than GET needs either a tool or code. A browser-embedded try-it console (like Apidoke's) is the lightest-weight way to handle those cases without installing anything.
Will the try-it console work on APIs that require HTTPS?
Yes, and in fact most browsers will block requests from an HTTPS documentation page to an HTTP API endpoint due to mixed-content restrictions. Your API should be served over HTTPS for the console to work reliably. This is a browser security rule, not something Apidoke controls.
Do I need to give Apidoke my API credentials to use the try-it console?
No. Credentials you enter in the try-it console are held in your browser session only. The request goes directly from your browser to your API server. Apidoke's infrastructure is not in that path and never sees the token or the response.
What HTTP methods does the try-it console support?
The console supports whatever methods you define in your API Blueprint document. GET, POST, PUT, PATCH, and DELETE are all valid Blueprint actions and will each render their own testable panel in the console.
Is this a replacement for Postman for all use cases?
For quick endpoint verification and consumer onboarding, yes. For automated test suites, CI integration, or complex pre-request scripting, Postman or a dedicated testing tool is still the right choice. The two approaches complement each other rather than compete directly.
Ready to give your API a live testable reference without any external tooling? Create your free Apidoke project and publish your first interactive API doc in minutes.
Related reading: API Documentation for Internal Teams: A Practical Guide
Related reading: Developer Portal vs API Reference: What Your Docs Site Actually Needs